How I saved a CFO 7 days a month using the tool he already owned.
Results
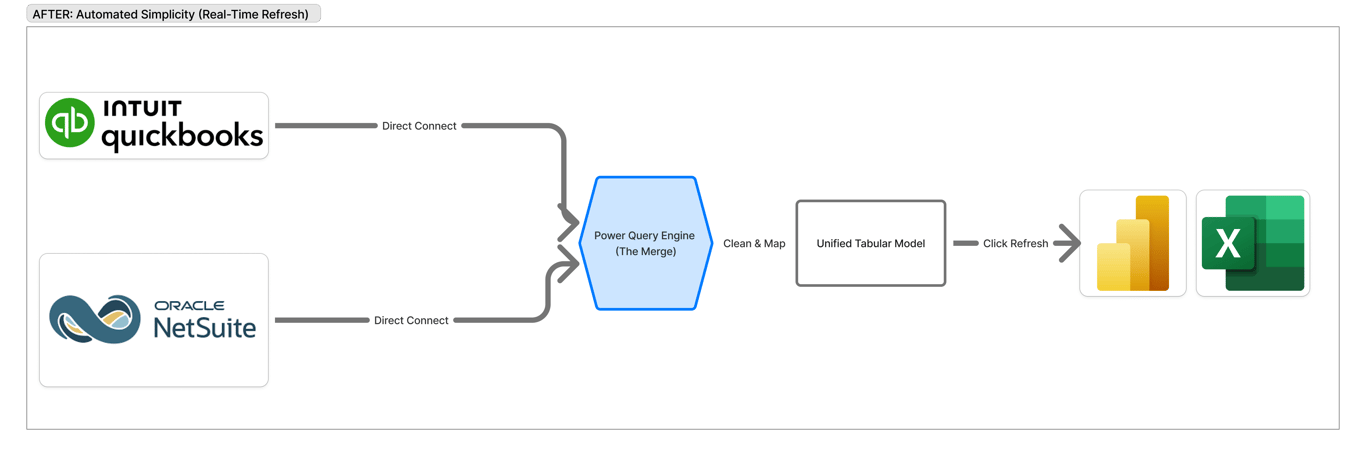
- Month-end consolidation went from one full week to real-time — a single Refresh click. That is roughly 7 days per month returned to the finance team.
- 34 legal entities across 18 branches unified into one standardized model.
- Management can see true EBITDA per branch, and group P&Ls by State, Regional Manager or Brand, instantly.
- Zero ongoing software cost — built entirely in Excel and Power Query.
Scale: 18 Branches (34 Legal Entities) Stack: Excel & Power Query (100% Native) Sources joined: NetSuite (32 entities), QuickBooks (2 acquired entities)
What was broken?
The client manages 18 schools with a complex legal and technical structure:
- 16 Branches in NetSuite: Split into 32 separate legal entities — holding entities for rent vs. operating entities for daily revenue.
- 2 Branches in QuickBooks: Recently acquired schools with a completely different Chart of Accounts.
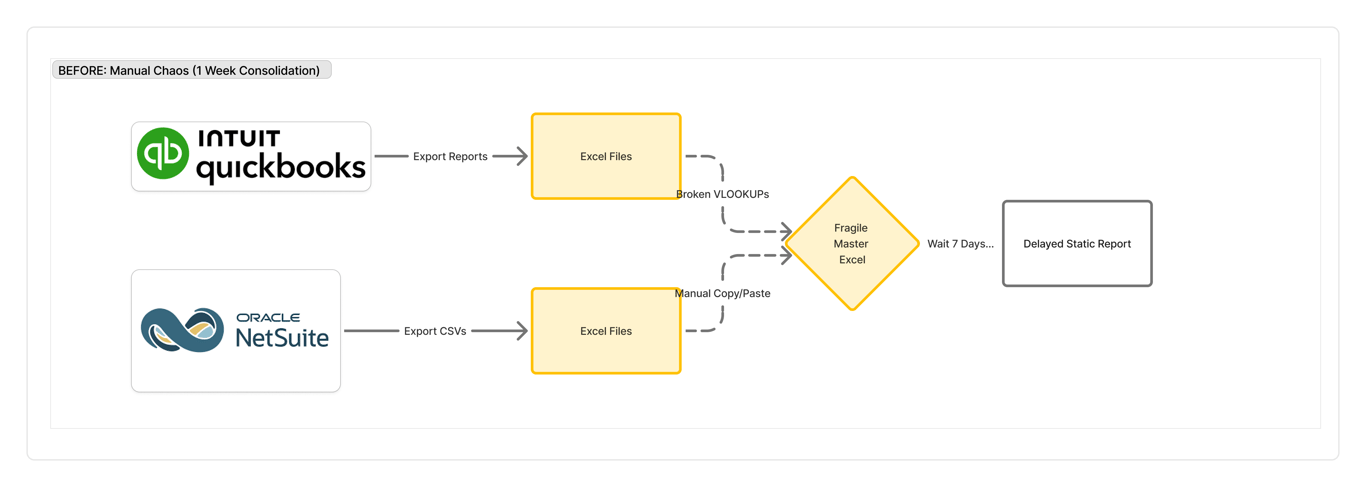
- The Blind Spot: Management could not see “True Profit” per school because major costs (rent) and revenue sat in different entities. Monthly consolidation took one full week of fragile, manual Excel work.
Before and after
Visualizing the shift from manual chaos to automated simplicity.
Why Excel instead of a data warehouse?
I could have built a complex cloud data warehouse, but I strategically chose Excel & Power Query.
Why? The C-Suite wanted full ownership. They did not want to rely on expensive external software or learn new systems. They wanted a tool they already trusted and could control themselves.
How the model works
I engineered a robust backend hidden within a standard Excel file:
- Unified Data Model: Connected to all 34 data sources simultaneously and flattened them into a single, standardized format using Power Query.
- The “Virtual Merge”: Built logic to automatically join the Holding Entity (Rent) with the Operating Entity (Revenue) to create a single, truthful “Reporting Location.”
- Cost Allocation Engine: Implemented logic that proportionately spreads Head Office expenses down to each branch for a fully-loaded P&L view.
What was the hardest part?
The hardest part was integrating the 2 newly acquired QuickBooks branches, as their Chart of Accounts was completely different from NetSuite.
The Fix: I built a user-friendly “Translation Table” in Excel. This allows the Controller to map new account codes in seconds without touching any code, keeping the system flexible for future acquisitions.
What changed
- Speed: Month-end consolidation went from 1 week to Real-Time (just click “Refresh”).
- Clarity: Management can finally see True EBITDA per branch and group P&Ls by State, Regional Manager, or Brand instantly.
- Impact: The CEO, CFO, and Controllers now use this tool as their primary base for all high-level strategic analysis, with zero ongoing software costs.